.svg)

Information to help understand Climate Change:
What climate change is, how our climate has already changed, and how it is expected to change.
Observed Changes in Climate: Climate change is defined as a statistically significant change in the mean state of the climate or its variability, persisting for an extended duration, typically decades or longer. The World Meteorological Organization (WMO) sets a minimum period of 30 years to define a region’s climate, on the basis of measurements of both the average state and variability of relevant meteorological variables. The Intergovernmental Panel on Climate Change (IPCC) utilizes a reference period of 20-years as outlined in its Fifth (IPCC AR5 WG I) and Sixth (IPCC AR6 WG I) Assessment Reports.
Throughout the 4.5 billion-year history of Earth, the parameters defining the climate have experienced significant fluctuations over extended timeframes. The recent rapid warming of the planet is largely attributed to changes in the atmospheric composition due to human activities, termed the “anthropogenic component of climate change” or “anthropogenic global warming.” This recent geological epoch, marked by significant human-induced alterations in Earth’s systems, including the climate system, was aptly named the “Anthropocene” by Professor Paul Crutzen. Natural factors, such as volcanic activity, variations in solar activity, or natural CO2 sources, play a minimal role in global warming.
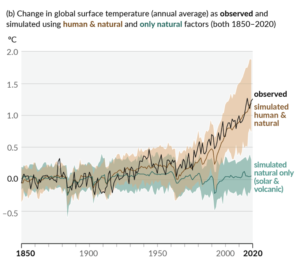
Comparison of observed global surface temperature changes with climate model simulations that include natural and anthropogenic (human-induced) forcings (Source: IPCC AR6 WG I).
Prior to the Industrial Revolution, which began in the mid-19th century, the Earth’s mean temperature remained stable around 14°C for about 11,000 years. The onset of the Industrial Revolution marked a significant increase in the combustion of fossil fuels such as coal, oil, and gas. This process releases energy but also emits greenhouse gases like carbon dioxide (CO2), methane (CH4), and nitrous oxide (N2O) into the atmosphere. These gases have accumulated in the atmosphere over time, with CO2 levels increasing by 40% in the 20th century compared to pre-industrial levels, and nearly 50% by 2023, reaching an average of 420 ppm. The atmospheric CO2 levels in 2019 were the highest in at least 2 million years. Scientific analysis reveals that the elevated greenhouse gas concentrations are the primary drivers of the current global warming trend.
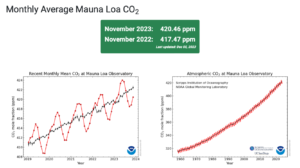
Increasing levels of carbon dioxide in the atmosphere from 1960 to 2023 according to measurements at the Mauna Loa Observatory in Hawaii (Source: : NOAA Global Monitoring Laboratory).
The mean temperature of the planet has risen approximately 1.1°C since the Industrial Revolution, with some regions experiencing higher increases. The latest IPCC report attributes a 1.07°C temperature increase to human activities.
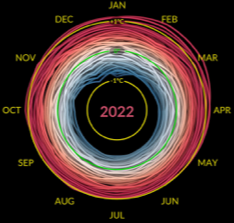
The “Climate Spiral” from NASA illustrates the monthly global temperature from 1850 to 2022, with the temperature increasing outward from the center of the spiral. (Source: NASA Climate Spiral).
According to the IPCC’s Sixth Assessment Report, climate alterations in the last 50 years are unparalleled for at least two millennia, and the recent century is likely the warmest in 100,000 years (IPCC AR6 Summary for Policymakers). Furthermore, the period from 2011 to 2020 was the hottest decade recorded, with a sharp increase in the rate of climate change. The WMO’s ( World Meteorological Organization’s “) report entitled “The Global Climate 2011-2020: A Decade of Acceleration,” states that rising greenhouse gas levels have led to record land and ocean temperatures and significantly accelerated ice cap melting and sea level rise.
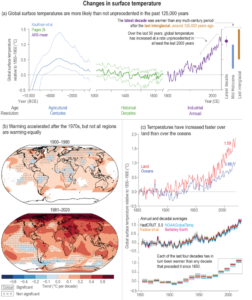
Indicators of a changing global climate system including: (a, c) the observed global mean of land and ocean surface temperature anomalies, and (b) a map illustrating the observed change in surface temperature from 1900 to 2020 (Source: IPCC AR6 WG I).
Copernicus Global Climate Highlights 2023 reports 2023 as the warmest year since 1850, with mean global temperature reaching about 1.5°C above pre-industrial levels, surpassing 2016 as the warmest year on record. The global mean temperature in 2023 was 14.98°C that is 0.17°C higher than in 2016. Each month in the second half of 2023 broke previous temperature records, with July and August being the hottest months ever recorded.
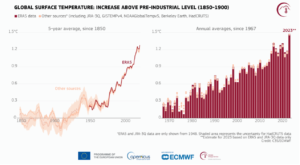
Increase in global air temperature (in degrees Celsius) above the pre-industrial mean for the reference period 1850-1900, based on numerous global temperature datasets, presented as:(left) five-year means from 1850, and (right) annual means from 1967 (Source: C3S/ECMWF).
What is the greenhouse effect?
The Earth’s troposphere, which is the lowest part of the atmosphere, has the property of absorbing mainly the longer wavelengths of outgoing infrared radiation from Earth’s surface, as shown in the figure below. The amount of energy absorbed depends on the gases present in it.
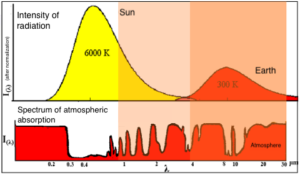
Emission spectrum of solar and terrestrial radiation and absorption spectrum of the Earth’s atmosphere (Source: ggeo.auth.gr).
About 23% of incoming solar energy (short wavelength radiation) is absorbed in the atmosphere by water vapor, aerosol, clouds and ozone, and 48% of it is absorbed by the surface. Evaporation and convection transfer 25% and 5% of incoming solar energy from the surface to the atmosphere. The Earth’s surface absorbing part of the solar energy radiates thermal infrared energy (i.e. emits longer wavelength radiation) . A very small part (about 12%) of thermal radiation from the surface passes through the atmosphere and directly escapes to space, while most of it is absorbed by the atmosphere and re-emitted, with the major part of the re-emitted infrared radiation being reabsorbed by the Earth’s surface. The amount of heat radiated from the atmosphere to the surface (sometimes called “back radiation”) is equivalent to 100% of the incoming solar energy. The Earth’s surface responds to the “extra” energy (on top of direct solar heating) by raising its temperature. This way, infrared radiation is “trapped” in the Earth’s atmosphere raising the Earth’s surface temperature to about 15 degrees Celsius on average—more than 30 degrees warmer than it would be if it didn’t have an atmosphere– a process known as the “greenhouse effect.” The high absorption of the Earth’s atmosphere infrared radiation is due to the gases in it named “greenhouse gases”. These include water vapor (H2O), carbon dioxide (CO2), methane (CH4), nitrous oxide (N2O), etc. Without the natural greenhouse effect, there would be no life on Earth as we know it today, as there would be no liquid water.
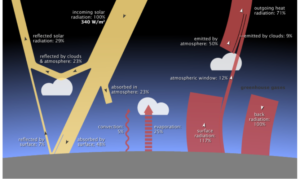
Energy fluxes between the atmosphere and the ground (Source: NASA Earth Observatory)
However, by adding additional greenhouse gases to the atmosphere, humans have created an enhanced greenhouse effect resulting in global warming. The greenhouse gases strongly affected by human activities are CO2, CH4, N2O and fluorinated gases (F-gases) (artificial gases used in a wide range of applications). Each of these gases has a different potential to trap heat, contributing differently to the greenhouse effect.
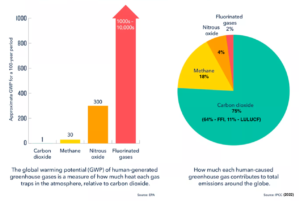
Contributions of individual greenhouse gases to total anthropogenic emissions (Source: nrdc.org). (the FFI rate refers to CO2 emissions from fossil fuel combustion and industry, the LULUCF rate refers to net CO2 emissions from land use, land use change and forestry)
What are the sources of greenhouse gases?
Carbon dioxide comes mainly from the combustion of fossil fuels and accounts for approximately 80% of anthropogenic greenhouse gas emissions worldwide. Human activities that produce methane include the production of natural gas and livestock rearing (e.g., cattle farming). Nitrous oxide comes mainly from the use of fertilizers in agriculture, while man-made fluorinated gases are mainly used in the refrigeration and air conditioning sectors.
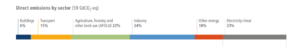
Global anthropogenic greenhouse gas emissions (in Gt CO2 equivalent) for the year 2019 by activity sector (Source: IPCC AR6 WG III_Chapter02).
According to the Intergovernmental Panel on Climate Change (IPCC), the year 2019, the energy sector was responsible for one-third (33%) of anthropogenic greenhouse gas emissions worldwide, with the combustion of fossil fuels for electricity and heat production comprising almost a quarter (23%) of these emissions. Their combustion releases mostly carbon dioxide and much smaller amounts of methane and nitrous oxide. The remaining percentage of emissions from the energy sector corresponds to one tenth (10%) of global emissions and concerns processes other than fossil fuel combustion, such as the extraction, refining and transportation of oil, gas and coal.
Almost another quarter (24%) of anthropogenic greenhouse gas emissions comes from the industrial sector, which includes the manufacture of products and raw materials (such as cement and metal), food production and constructions. In addition to carbon dioxide and methane, this sector is also responsible for emissions of nitrogen oxide and fluorinated gases.
Just over a fifth (22%) of global greenhouse gas emissions come from agriculture, forestry and other land use (AFOLU) sector. Emissions from agriculture mainly concern methane and nitrous oxide. Trees, plants and soil absorb carbon dioxide from the atmosphere – trees and plants through the process of photosynthesis, soil through the sequestration of carbon dioxide by various microbes present in it. Large areas of forest have been converted into arable land for human and animal rearing needs. The sector of forestry and other land uses (reforestation, tree planting, etc.) can therefore reduce, through absorption, carbon dioxide in the atmosphere but at the same time, it can also increase the amount of carbon, as deforestation prevents absorption of carbon dioxide. Additionally, burning or decomposing biomass releases carbon dioxide back into the atmosphere, allowing it to build up even more in the atmosphere.
The use of fuels, mainly oil and gasoline, for human transportation accounts for 15% of global greenhouse gas emissions. Carbon dioxide is the main gas emitted, along with smaller amounts of methane and nitrous oxide, but also fluorinated gases from vehicle air conditioning systems.
The building sector produces 6% of global greenhouse gas emissions. These consist primarily of carbon dioxide and methane, which come from burning natural gas and oil for heating and cooking, and secondarily of fluorinated gases that escape from air conditioning and refrigeration systems and from waste management.
The annual inventories of greenhouse gas emissions are an essential tool for environmental policy-making and contribute to the process of monitoring the measures related to the reduction of greenhouse gas emissions from the various sectors of economic activity and the strengthening of absorption from the sector of land use, land-use change and forestry. The chart below shows the temporal evolution of greenhouse gas emissions/absorptions from 1990 to 2021 in Greece, broken down into the energy (including transport), industrial processes, agriculture, waste and land use -land use change-forestry sectors.
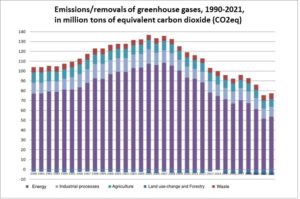
Annual national greenhouse gas emissions/absorptions from 1990 to 2021 (Source: Ministry of Environment and Energy, 2023).
(Sources: Met Office, Department for Environment and Energy, NRDC, IPCC AR6 2022)
Climate change affects all regions of the world. Polar ice is melting, and the sea level is rising. Some regions experience more frequent extreme rainfall, while others endure severe heatwaves, droughts, and devastating wildfires. At the same time, the oceans are affected by more frequent marine heatwaves and are undergoing acidification due to decreased pH levels.
The impacts of climate change are expected to intensify in the coming decades, particularly after 2050.
Following, examples of impacts of climate change on the Earth’s system and of threats to society in specific territorial regions of the planet are presented.
Impacts on the Earth System
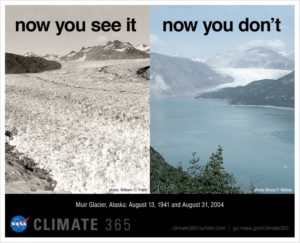
Melting Ice and Rising Sea Levels
Global warming causes ice caps to collapse at the poles and glaciers to melt. At the same time, when water is heated it expands. Because of these changes, sea levels are rising, causing flooding and erosion of coasts and low-lying coastal areas.
Extreme Weather Events
Heavy rainfall is becoming more frequent and causes flooding and degradation of water quality, as well as limiting water resources in some areas.
Heatwave intensity and duration have increased worldwide, in most regions since 1950, almost certainly due to human-induced climate change. Also, further changes in extreme hot and cold events are almost certain to occur throughout the 21st century in almost all inhabited areas, even if global warming stabilizes at +1.5°C compared to pre-industrial period.
Threats to Fauna and Flora
Climate change is happening extremely fast, and many species of plants and animals are struggling to cope with the new climate conditions.
Shifts in habitats are already occurring for terrestrial and aquatic species. Some plant and animal species will face a high risk of extinction if the Earth’s mean temperature continues to rise without control.
Social threats
Threats to Human Health
Climate change is already affecting health:
- There has been an increase in the number of heat-related deaths in some regions and a decrease in cold-related deaths in others.
- We are already seeing changes in the distribution of some waterborne diseases as well as vector-born diseases (e.g. West Nile virus vectors)
Cost to Society and the Economy
Material damages, damages to infrastructure and impacts on human health entail high costs of climate change for the society and economy.
Between 1980 and 2011, floods affected more than 5.5 million people and caused direct economic losses of more than 90 billion euros.
Temperature and precipitation-sensitive sectors like agriculture, forestry, energy, and tourism are particularly vulnerable.
Territorial threats
Southern Europe, Mediterranean, and Greece
Southern and central European regions are increasingly affected by heatwaves, wildfires, and droughts. A temperature rise of 2°C to 4°C will reduce precipitation by up to 30% in southern Europe by 2080.
The Mediterranean region is warming 20% faster than the global average. Water scarcity in the Mediterranean areas is constantly increasing, resulting in increased risks of drought and uncontrolled fires. Global warming by 2°C will reduce rainfall in the Mediterranean by about 10% to 15%. Sea surface temperature is expected to increase between 1.8°C and 3.5°C by 2100 with higher increases in Spain and the Eastern Mediterranean.
In Greece and neighboring countries, the increase in the frequency of extreme weather events will be accompanied by a decrease in rainfall, drought and an increase in the frequency of forest fires.
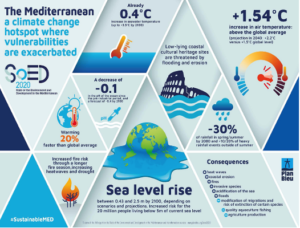
Summary of climate change impacts in the Mediterranean (Source: UNEP).
Information on climate and climate change in the Mediterranean can also be found on the following websites:
–First Mediterranean Assessment Report (MAR 1) by MedECC, an independent network of scientists on climate and environmental change in the Mediterranean.
–State of the Environment and Development in the Mediterranean (SoED).
Developing countries
Many developing countries are among the most affected countries. The people who live there are often highly dependent on their natural environment and have the fewest resources to cope with climate change.
(Source: European Commission, UNEP).
As a Mediterranean country with thousands of islands, Greece is particularly vulnerable to the effects of climate change. In particular, Greece is threatened by extreme climatic phenomena, frequent heat waves, drought, floods and forest fires. Decreasing rainfall and rising average temperatures are already affecting the economy and ecosystems. Large areas have been deforested by fires, infrastructure has been damaged, and lives have been lost.
The first comprehensive study of the environmental, economic and social impacts of climate change in Greece was published in 2011 by an interdisciplinary committee established by the Bank of Greece (EMEKA, 2011). Among others, the study found that rainfall levels are likely to decrease between 5% and 19% across the country by 2100, while temperatures will increase between 3°C and 4.5°C. Heavy rainfall is expected to become more frequent in eastern and central Greece and northwestern Macedonia, while drought will increase over the eastern mainland and northern Crete. The update of this study is ongoing in the framework of the LIFE-IP AdaptInGR project.
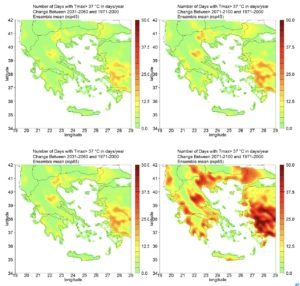
Changes in the number of days with maximum temperature > 37°C between 2031-2060 and 1971-2000 (left) and between 2071-2100 and 1971-2000 (right) in the case of a mitigation scenario of greenhouse gas emissions (RCP4.5, top) and in the case of a no-action scenario for the mitigation of greenhouse gas emissions (RCP8.5, bottom)
(Source: EMEKA update, 2024).
The impacts of Climate Change per sector in Greece are presented in the sectors section.
Climate projections are simulations of the Earth’s climate in future decades (usually up to 2100) based on “scenarios” for the concentrations of greenhouse gases, aerosols, and other atmospheric components that affect the planet’s radiation.
Climate projections are obtained from the application of numerical climate models, which may cover:
- the entire globe and are referred to as Global Climate Models or General Circulation Models (GCMs)
- a specific region (e.g. Europe) and are called Regional Climate Models (RCMs).
GCMs, describe the physical processes in the atmosphere, ocean, cryosphere, and land, and are the most advanced tools currently available for simulating the response of the global climate system to increasing greenhouse gas concentrations. GCMs, in combination with RCMs, have the potential to provide geographically and physically consistent estimates of climate change needed for its impact analysis.
GCMs simulate the climate using a 3D grid over the entire globe, typically with a horizontal resolution between 100 and 500 km, comprised of 10 to 20 vertical layers in the atmosphere and sometimes up to 30 vertical layers in the oceans. Their analysis is therefore quite coarse. Many physical processes, such as those associated with clouds, occur at higher scales and cannot be modeled properly. In these cases, their known properties must be averaged using a technique known as parameterization. This is a source of uncertainty in GCM-based simulations of future climate. Other uncertainties are related to the simulation of various feedback mechanisms, related for example to water vapor and warming, to clouds and radiation, to ocean circulation, and to the albedo of ice and snow. For this reason, GCMs may estimate quite different results with the same input data, simply because of the way certain processes and feedbacks are modelled.
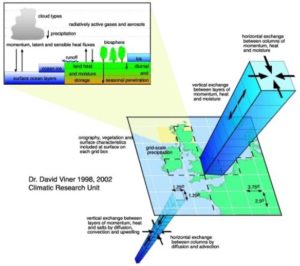
Schematic description of a General Circulation Model (Source: IPCC Data Distribution Center).
However, while the differences in the response of GCMs are usually consistent with the range of climate sensitivity, they are unlikely to satisfy the uncertainty range of regional projections. Even selecting all available GCMs experiments would not guarantee a representative range in regional predictions, due to other uncertainties that GCMs do not fully address, especially the range in estimates of future atmospheric composition.
RCMs can provide climate change information on regional and local scales in relatively fine detail, which cannot be obtained from coarse scale GCMs. RCMs simulate the physical processes of the climate system (similarly to GCMs) and cover a limited land area at a high spatial resolution (10-50 km). RCMs are not independent from the GCMs, since the GCMs provide lateral and lower boundary conditions to the regional models. In that sense RCMs can be viewed as magnifying glasses of the GCMs. Data extracted from GCMs, such as pressure, wind, temperature, and precipitation at various levels for the region of interest, are used in RCMs.
The IPCC WGI Interactive Atlas is a new tool for flexible spatial and temporal analyses of much of the observed and projected climate change information, developed as part of the Sixth Assessment Report of the Intergovernmental Panel on Climate Change by Working Group I.